Entitled to Freshness

Imagine you’re a company that has a 2 billion row fact table joined to a 100k row entitlements table built for row-level security. The fact table updates monthly, but entitlements change every time someone gets promoted, quits, changes title, etc. You can’t just refresh the whole data model monthly, because you’d end up with the wrong security rules applied. You also can’t refresh the entire data model multiple times a day, because refreshing that fact table would put a huge toll on your back-end systems as well as your Tableau Server. Within the Tableau UI, however, there’s no option to independently refresh the different parts of a datasource – if you schedule a refresh for your entitlements table, it’ll refresh your entire datasource.

Sometimes when you open Tableau, you’ll find that out-of-the-box functionality takes care of…well pretty much all of your needs. There are a handful of places, however, when you’ll really need to tap into the APIs. One such use case is for row-level security scenarios where you a) can’t use Virtual Connections and b) need to refresh your entitlements table more frequently than your fact table.

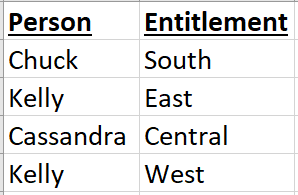
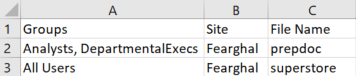
Quick vocab break: an Entitlements Table is a table which tells us who can see which data. This table should be updated as people gain/lose access to other data.

So how do we solve this? Well option 1, as mentioned above, is Virtual Connections. This allows independent scheduling for each table in the VConn, giving you the mixed freshness you desire. But some folks can’t use VConns – maybe the fact table refresh would time out, maybe you’re using an unsupported connector, maybe you have weird auth issues. How can we approach the problem in this case?

Luckily, there’s a combination of the Hyper API and the REST API in Tableau that can address this very efficiently.

  1. Create an extract of your fact and entitlements tables using the Hyper API.
  2. Open these in Desktop, create a data model, and publish.
  3. Schedule no refreshes in Tableau at all!
  4. When entitlements change, re-create your Entitlements table using the Hyper API.
  5. Use Tableau’s new(ish) APIs to update just the entitlements portion of your datasource.

Now depending on the type of person you are, that either sounds really easy or really hard, so I’m going to break it down bullet by bullet. There’s a github repository with some shoddy Python code available here.

1. Create Extracts Using Hyper API

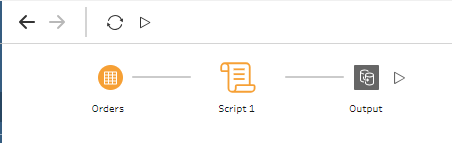
This is the heaviest lift part of it all. The first question you’re asking is “why don’t I just use Desktop to create these?”, and it’s a valid question. For the initial publish, it’s certainly possible, but to enable a live-to-Hyper connection (which we’ll need later), we need to make sure we’re not setting this up through the native UI. The Hyper API is designed to build extract files outside of Tableau, which is exactly what we need. I’ve built a sample script here which shows how you could do it from a SQL Server deployment.

The file this creates is a single Hyper file which contains two tables: “Fact” and “Entitlement”. Because a Hyper file is data (as opposed to metadata), this doesn’t yet enforce any data security or have any relationship between the two tables.

2. Create a Data Model

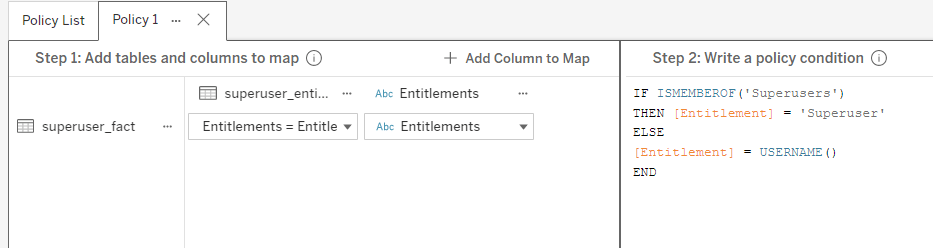
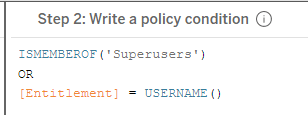
Double-click the Hyper file you created in Step 1 to open it in Desktop. From here, you can build your data model (join the tables but also write whatever calculations you need etc). You’ll also want to take this opportunity to build in your row-level security. Now that you’ve got data which is joined, enhanced, and secured, you can publish it to your Tableau deployment. This is no different than a normal publish process, except that the datasource (having been built/published differently) is eligible for live-to-Hyper updates.

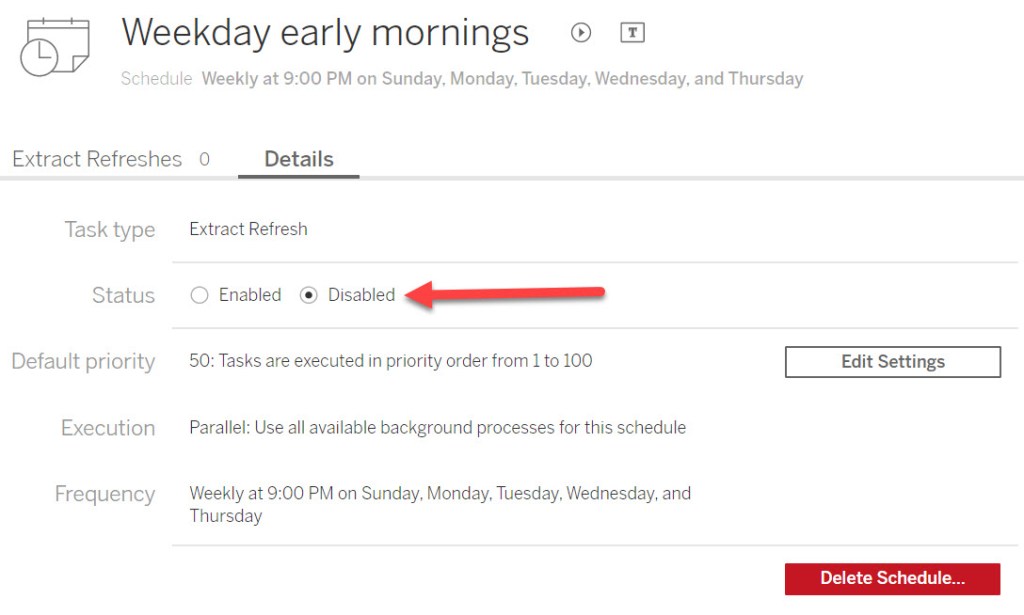
3. Schedule No Refreshes!

You’ve got it. Just resist the temptation to schedule anything in Server or Cloud. Because of the way this was built, you shouldn’t be able to anyway.

4. Re-build Entitlements as Needed

So far, we’ve just found a difficult path to creating a normal datasource, so there better be a payoff. This is where it happens. Now imagine someone leaves your company or changes titles – they need data access revoked immediately. Historically, we’d force you to refresh your entire data model. This could take hours, be quite costly, and may not even finish before you want to update it again.

With these APIs, however, we can just re-build the Entitlements table. We can re-use the script from step 1 here, but cut out all of the lines about the Fact table. We’re rebuilding just the smaller table, which will likely take mere seconds.

5. Replace the Server-Side Entitlements

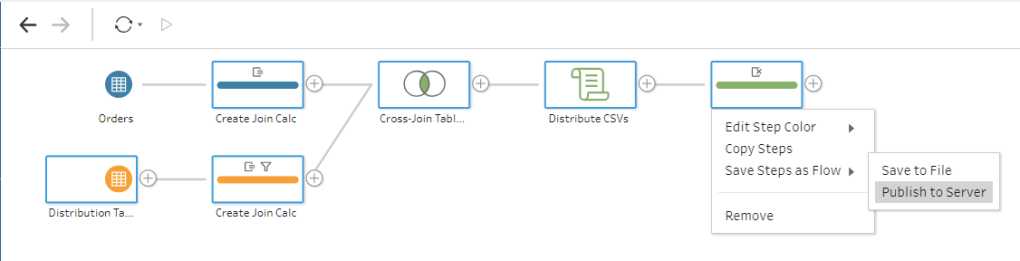
All we’ve done now is create a smaller local Hyper file. It contains none of my actual data, just my entitlements. If we were to publish this from Desktop, it would create its own datasource. Instead, we can push this table to overwrite just a portion of our existing datasource. The code provided here shows you how to

  1. Execute step 4 (above)
  2. Identify your target datasource
  3. Initiate a file upload (large files must be chunked, small files can be uploaded all as one)
  4. Commit the file upload to the appropriate data source and table name.

This is the final portion of the code. As long as your datasource ID, schema name, and table name line up, you can easily replace the entitlements table without touching the fact table!

6. Confirm It Worked!

Now go re-load any dashboard downstream of that data. The data won’t have changed, but the entitlements will have. Anyone promoted will have their enhanced access, anyone who quit will lose all access. This means you can easily kick off a flow many times a day, as people gain and lose access, without any worry about bogging down your system!

What Else?

This example is intentionally narrow, and built to solve a specific problem. There’s tons more you can do with these APIs, though! If you have a massive fact table and want to add just a small number of rows to it, this API allows you to append. If you want to maintain a file which has a rolling 12-month snapshot, you can write a simple script to delete-and-add rows. All up, this allows you far more flexibility than Tableau’s traditional refresh. Choose what data you care about, down to the row level, and manipulate it as you see fit!

All for Some, and Some for All

Row Level Security: Implementing “All Access” or “Deepest Granularity” methodologies

Virtual Connections, released last year, allowed Tableau an easy way to deploy row level security at scale. You can easily build governance policies in a single place, against a single table, and have them flow down to your entire organization. These policies can be easily audited and edited as your business needs change, and you can be assured that your changes will flow down to all content living downstream of the VConn. The only remaining hurdle is figuring out the appropriate policy for your data.

Tableau’s base recommendation for RLS is to create an entitlements table with one row per user per “thing they should access”, or entitlement. A sample table might look like the below.

For every Person, a Region, and for every Region, a Person.

This works perfectly well for a small group of users, and even scales well as your users and entitlements grow! Where it can begin to struggle, however, is when people have access to multiple regions. I’ve written a post for managing multi-entitlement access, but there’s another type of user it didn’t account for: the superuser. Whether it’s an exec, manager, or simply an entirely different business unit (analysts, for example), there’s often a swath of users who should be able to access everything. We could individually enumerate each user and give them access to every single entitlement, but imagine a scenario in which we have 15,000 entitlements and 15,000 users. Our entitlements table could balloon to tens of millions rapidly!

The old approach, detailed in our RLS whitepaper, required joining 2 additional tables to your fact table. VConns, as currently built, only allow for a single join, so this requires a new approach. Good news, though, it’s a relatively simple approach.

  1. Create a group on your Tableau Server for all of your “superuser” folks. I simply called mine “Superusers”. Add all of your superusers to this group.
  2. Add 1 row to your entitlements table with “Superuser” in both columns.
  3. Modify your fact table. There are a couple things we’ll have to do here.
    • Duplicate the column you use for your Entitlements join (the Region column, in my example).
    • Union your table to itself.
    • In the unioned copy of the table, replace all values in the Entitlements column with “Superuser”

I’ll show these modifications with some images. Consider the below fact table (only 3 rows).

I’ll union this table to itself, doubling the size (6 rows now). Add a new column for Entitlements (as a copy of the Region column). In rows 4-6, however, the Region has been replaced by the word “Superuser” in the entitlements column.

The green indicates rows added via the union, and are a perfect copy of the original fact table. The orange indicates the new column we’ve added for modified entitlements.

With this modified fact table, we’ll no longer need multiple joins. A single join in our VConn, with the appropriate policy, will now be sufficient to pass in all the info we need.

This policy first checks to see if a user is a superuser. If so, they get access to 1 entire copy of the dataset. If not, they’re subjected to the normal RLS rules.

So that’s how, but why?

If all you care about is getting the work done, read no further! If you’re curious about the query execution behind the scenes because you may want to further customize this solution, read on. It might seem like a bit of a convoluted approach at first glance. The simplest approach wouldn’t seem to require any data modification at all. Why not just write a policy which checks ISMEMBEROF(‘Superuser’) and, if true, returns the whole dataset?

The answer lies in join cardinality and join culling.

First, we’ll address join culling. There’s a tendency to assume that we could write a policy like the below, and use our base entitlements table.

We assume that if a user passes the ISMEMBEROF() check in our policy, the entitlements join will no longer happen. We’re not using the entitlements table for anything, so why bother joining it in? The way Tableau operates, however, means that once you’ve added the entitlement table to your policy, it will always be a part of your query, even if no columns are directly referenced in the policy. No matter what happens, the tables will join and the query will execute.

But why is that a problem? That answer comes from cardinality. If each row in your dataset can only be viewed by one person, and each person can only view one row, then you’ll actually be ok with this. Unfortunately, not many businesses are that simple. Most of the time, each user can view multiple rows, and each row can be viewed by multiple people. Take the simple example below, a 5-row entitlements table. It’s the same example from the beginning, but we’ve added one more user who can see the West region.

We now have 2 copies of “West” in the Entitlements columns of the Entitlements table. If we were to join this table to our fact table and query it, we’d end up doubling all the sales from the West. In a non-Superuser experience, however, this doesn’t matter. Tableau would first query the entitlements table to the appropriate user (let’s say Kelly, in this case) and then query the joined tables.

SELECT SUM(Sales) FROM sales JOIN entitlements ON sales.entitlement = entitlement.entitlement WHERE Person = 'Kelly'

The entitlements table would be filtered, the join would execute, and because there are now no duplicate values in the [entitlement.entitlement] column, no duplication occurs. Kelly sees the appropriate sales data. If, on the other hand, a Superuser logs in and queries, they’d receive the entire resulting table.

SELECT SUM(Sales) FROM sales JOIN entitlements ON sales.entitlement = entitlement.entitlement

In this case, there’s no WHERE clause, so they receive the unfiltered data. Because “West” appears twice in the [entitlement.entitlement] column, our sales in the West region get doubled. Of course, in practice, the impact will probably be much larger. There may be 5000 employees who can access the West region, and 3000 who can access the East. We’d have to do some silly math to try to reduce these numbers back to their de-duplicated state, and it would result in a lot of query overhead. Instead, we want to attempt to just query the raw, unduplicated fact table .

…and how does it work?

Really, a union is odd behavior to use here, because all we want to do is cull out the join. Because the join is unavoidable, however, we need to instead find a way to remove all duplication from the join. To do this, we unioned the fact table to itself. The duplication only happens when entitlements are joined together, so we need to make sure we don’t perform a many-to-many join. By materializing a single “Superuser” row in our entitlements table and creating a separate copy of the fact table that joins directly to it, we have effectively made a separate copy of the table for a superusers to query. The query we execute will be the same as above, but we’ve added a WHERE clause back on.

SELECT SUM(Sales) FROM sales JOIN entitlements ON sales.entitlement = entitlement.entitlement WHERE entitlement.entitlement = 'Superuser'

We know that ‘Superuser’ appears only once in our entitlements table (unlike the Region values, which may be repeated). As a result of this, we know that the fact table does not get duplicated. Our superusers see all of the data, but in its unduplicated glory!

[Multi-Value, Multi-Column] Row Level Security: Solving an Array of Use Cases

Virtual Connections have completely changed how Tableau connects to data, streamlining the processes of credential management and extract refreshes, while also reducing duplicate queries against your expensive databases. It also introduces the concept of centralized row-level security, or CRLS. Having a single point to create, audit, and edit your security policies allows for instant scaling of your data governance, and it also allows for better distribution of responsibilities.

In pre-VConn Tableau, the people building your datasources and workbooks were also the people responsible for building governance. This isn’t how most organizations work, however: data governance and dashboard buildouts are two totally separate functions. By separating VConn creation out from the analytic tasks, we let governance owners do what they do best, and let analysts confidently build, knowing that they don’t have to worry about security.

 Before VConns, governance was applied at every datasource or workbook. Even similar datasources required duplicate credentials, duplicate refreshes, and duplicate RLS policies.
With VConns, there’s a single point of governance application. This frees up backgrounders from duplicate refreshes, allows data stewards to set governance in a single place, and can save on costly duplicate queries against your data stores. 

All that said, this has brought an increased focus on Tableau’s existing row level security approaches. Many of the approaches detailed in the whitepaper rely on multiple joins, and VConns currently support only a single join. On top of that, people often have complex data models and rules. It’s not uncommon for data entitlements to be based on multiple columns, each of which have multiple values.

Consider a Regional Sales VP for certain categories. They may have access to their product categories across the whole country, but also have access to ALL sales within their regions. We need to evaluate two separate entitlements and check if either of them has been fulfilled. Traditionally, these may be kept in two separate entitlements tables. We have techniques for doing this in the whitepaper, but they require multiple joins, and VConns only supports a single entitlements table.

 Traditional RLS approaches would have you join both of these tables and do some calculation magic.

With VConns, however, we can combine these into a single entitlements table that represents all our entitlements, gives us an efficient query path to searching them, and provides a simple audit interface for our admins. Simply create one column for each entitlement (Category and Region, here) and populate them with pipe-separated arrays. You’ll have one row for each user which displays their entitlements.

 It’s easy to look at this table and find who can see what, and it also allows easy insertion of an ALL value instead of a complete list.

All that’s left is stitching this together with our fact table.

  1. Create a cross-join between your fact table and your entitlements table.
    • This is a scary first step, but just trust me for now. I know if we went on to evaluate this entire query, we’d end up with a massive dataset. The good news is that we’ll never actually execute the cross-join against the full tables, so for now, simply join on 1=1.
  2. Create a policy that checks for USERNAME() = [User] match.
    • This is the key to making the cross-join performant. This policy will act as a WHERE clause in our query, and (because we only have 1 row per user) it will filter our entitlements table down to a single row. Because of what’s referred to as “Filter Pushdown”, any decent database will perform this filter before joining the tables, so our cross-join will join our fact table to a 1-row entitlement table, creating no duplication at all.
    • Our data structure is now a non-duplicated copy of the fact table, but with the current user’s entitlements added onto every row as new columns. A small sample may look like this:
  3. Create a policy that checks entitlements.
    • First, we’ll check the Region entitlement. We need to check two things: is the entitlement ALL and, if not, does the Region on each row match the entitlement.
    • [Region Entitlement] = “ALL” OR (CONTAINS([Region Entitlement], [Region])
    • This calculation returns TRUE if the user is entitled to ALL or if the region in question is contained in their [Region Entitlement] array.
    • Repeat for each other entitlement you need! In this case, it’s just one more entitlement. Because we want to check either of these entitlements, we’ll use an OR statement, but if you want to check both you can use AND.

Voila! We’ve implemented governance against a single table, using only 1 entitlements table. It’s a flexible policy, allowing for ANDs and ORs, multi-value lists, and multiple entitlements. It’s easy to read, and, when combined with VConns, it’s easy to implement in a single place…and flow downstream to your entire server. No more worrying about searching out every workbook, no more downloading 500 workbooks to edit them, and no more managing multiple entitlements tables.

Handling governance centrally lets your BI Analysts do BI, and lets your Governance Analysts handle the governance. It allows you to centralize the security, but also all of the connection metadata, making administration a breeze. It lets your end users trust that the data is correct and secure, and reduces the nerves of the folks in your InfoSec department. Implementing complex RLS at scale has never been so easy!

You, Robot: Responsibly Democratizing AI

NB: In many contexts, AI and ML overlap but are distinct. In this post, I’m using them basically synonymously and completely interchangeably. Feel free to find/replace them all w/ the acronym of your choosing for a more pleasant reading experience.

Tableau has just released an integration with Einstein Predictions, and there’s a ton to be explored and celebrated with that. It’s the first formal integration between Tableau and Salesforce stacks since the acquisition, it’s the easiest AI/ML in any BI product around, and it truly lowers the barrier to entry for people who know nothing about R, Python, etc. And it surfaces some great insights!

Who could argue with these insights?

But as we all know, with great power comes great responsibility. ML has the power to find new insights in our data, find new ways to optimize processes, maximizing profit and minimizing cost. It also has the potential to augment some of our worst flaws and augment existing biases. I recently re-read Cathy O’Neil’s phenomenal book “Weapons of Math Destruction” on the risks we take with ML, and it feels incredibly relevant to this situation. Many in the traditional Tableau userbase may have little experience with ML up until now (yes, we do love TabPy), so it’s worth highlighting some of her advice through a Tableau lens. Consider this my own take on her book, which you should read!

Two seminal works on the possible impacts of irresponsibly-deployed artificial intelligence.

The author lays forth 4 potential (and historical) problems with ML, and I’ve added on two of my own, along with my suggestions on how to approach each. Each of these, if followed, will help us create and deploy models that are not only more responsible but also more effective, removing detrimental human bias and adding efficiency wherever possible.

Her 4…

  • Scalability
  • Lack of Opacity
  • Model Regulation
  • Contestability

…and my own few…

  • Confusing Optimization for Innovation
  • Confusing Metrics and Targets

Scalability

This is literally the entire concept of creating citizen data scientists. We’re looking to allow more people to implement more data science in more places. It’s also the single biggest risk. Anything deployed irresponsibly can cause damage, but people’s inherent trust in AI and their willingness to “Set it and forget it” means that it can impact business processes at massive scale. O’Neil notes that the ease at which ML is scaled now (and the ease of scaling its impacts as well) means that irresponsible usage can have dangerous implication. Whether the negative impact is a social one (AI has been used to justify over-policing poor neighborhoods) or a business one (a poorly trained model could tell you to sell the wrong products to the wrong people), the ability to scale AI’s impact is also the ability to scale its potential for failure. Fear not! If attention is paid to the rest of her notes, ML can be deployed responsibly and in a helpful manner.

Opacity

Too often, ML models are trained on an entire dataset, deployed and accepted without appropriate documentation. A successful model should allow the end users to see what goes INTO it so they know they can trust what comes OUT of it. ML models are built entirely on training datasets, which are historical records. Historical records reflect our own biases in every way. These biases may be innocuous (an ML model would find that I should work harder before I’ve had my coffee) or massively impactful (ML models will reinforce histories of racism, sexism, and a whole host of -phobias). Avoiding opacity helps to build trust in your model, as well as allowing users to recommend additional variables that SHOULD be included in it. Even if we exclude the directly discriminatory elements, how many other elements correlate with those? Amazon was forced to scrap a hiring algorithm after it recommended not hiring attendees of all-female colleges. What proxies exist in your data, and how will you guard against them? Predictions helps with this in that it shows primary drivers of a prediction. Documenting the rest of your model is a key step to building trustworthy, effective models. Einstein’s ability to surface the reason for a prediction helps with accountability and transparency.

A prediction may not raise eyebrows until you look into the explanations behind it.

Difficult to Contest

ML models, at the end of the day, surface predictions, not sureties. They may seem similar, but it’s an important distinction. Especially when it comes to making high-impact decisions (remember that “impact” applies not only to the business, but the consumer as well), presenting AI projections as fact is irresponsible, and consumers should be protected from fully AI-based decisions.

Anecdotally, I was in southern Washington two weeks ago and we came to a cash-only toll bridge. We pulled over to an ATM to get $2 in cash. An AI system flagged our card as suspicious activity, and we spent 45 minutes on the phone with Charles Schwab just so we could be allowed access to our own money. In our case, this was harmless (we got ice cream and sat by the bridge) but automated denial of access to one’s own belongings could have serious consequences. What if there was a time-based need for the money? What if my phone was dead? Uncontestable or difficult-to-contest decisions deliver bad customer experience, can punitively impact the most vulnerable customers, and can set your AI implementation up for failure. Remember that AI is only profiling a set of dimensions, it can’t know the individual’s intent.

Optimize vs Innovate

An ML model is built to take our existing processes and tweak and hone them to perfection. Even if we deploy a model completely free of bias, at best it will only perfect our current process. To butcher a Henry Ford quote (it’s apocryphal anyway), “If we asked ML what it wanted, it would’ve optimized for faster horses”. ML isn’t here to invent the car! Allow ML to perfect your existing processes, but don’t pretend it’s a replacement for human innovation.

Use ML in tandem with what your users know about the business. Successful AI implementations in BI are a work in progress, but they’ll likely involve a balance of AI and human involvement. Allow AI to help fine-tune processes and expose wasted expenses, but allow the data consumers to find creative solutions to those problems in ways that AI can’t innovate. Better yet, put Einstein next to AskData to allow users the ability to explore the data with Einstein as a guide for which fields may be most important!

Convert AI Insights into exploratory guidelines with Einstein + AskData

Targets vs Metrics

Don’t allow yourself to confuse a target and a metric, because once a metric becomes a public target…it loses its value as a metric. If people are trying to attain a metric, rather than the outcome that the metric measures, you’ll optimize for the wrong scenario.

Imagine I build a model seeking to maximize profit, and it tells me I should sell direct to consumer, rather than through any third parties. I then publish this as a target for my internal salespeople, with a prize for whoever sells the highest % direct to consumer. A clever salesperson will win first prize (as you know, a Cadillac Eldorado) by simply not selling anything to a third party…but ultimately that may cut down their sales by so much that they have almost 0 profit. They’ve achieved the metric, but at the cost of the target. The book details an incredible example of how Baylor has cheated an equally flawed algorithm regarding the college admission process, and how it completely invalidates the models we began with. How do you avoid this scenario?

  1. Ensure that the model is being pointed at the desired outcome, not something that correlates with the desired outcome.
  2. Ensure that people implementing policy as a result of the model understand what the model does and doesn’t recommend.
  3. Align incentives with real-life outcomes. The scenario above should seek to maximize profit, not direct-to-consumer sales!

Overall, ML in BI creates a huge opportunity. Allowing casual business users to train and deploy models can unclog bottlenecks in your data science department, making data science available for all sorts of projects, not just the top-line massive-budget projects. Dashboard builders can use this to influence which dimensions they should ignore, and which they should dig in on. Casual consumers of dashboards get additional context as to why the data they’re looking at is important. Web Editors and AskData folks now have a way to drive their exploration towards a target, rather than wandering aimlessly through massive data models.

At the same time, the expanded userbase means an expanded base of people responsible for deploying models. These people should be taught about AI/ML, what “intelligence” really means in that capacity, and how it can be used to harm both people and businesses. Responsible deployment of AI isn’t a one-time effort, it’s an ongoing enablement of employees and inspection of models.

Tableau as Traditional BI

Tableau was one of the early self-service BI vendors, and has really made it’s impact by allowing any end user to not only access data, but to interact with it, ask their own questions, and build their own vizzes. The idea is to actually empower users to get what they want out of data, rather than what you prescribe.

That said, having sold Tableau for 4.5 years, I’ve come to realize that no matter how great self-service BI is, there are certain pieces of “Traditional BI” that people can’t let go of, no matter how value-less they seem. After hearing the same request enough times, sometimes you just have to cave to tradition and allow the Cognos users their one feature request.

“The less there is to justify a tradition…the harder it is to get rid of it” — Mark Twain

Luckily, the 19.3 release of Tableau came with two features which make this incredibly easy. The ability to use Python in your Prep flows makes it really easy for anyone who can write Python to distribute CSVs. A 20-line Python script could distribute the relevant data to the users you want, but not everyone can write Python. The reusable steps option in Prep Builder 19.3 makes it easy to socialize this content, providing an easy skeleton for any user to use your Python flow.

The last piece of the puzzle is choosing the end users who should receive the report. By building a consistent table which can be incorporated into your flow, you can centralize this piece as well. I’ll walk through the steps below.

One column has a list of Groups you’d like to send the email to, one column has the name of the Site those Groups exist on, and one column has the File Name that the CSV should be distributed with.
  • Build a Distribution Table. This can be in a database or a simple CSV document, and should have the below structure.
  • Create a Tableau Prep flow. This can be as simple as a single file that you want to send as a CSV or it could be a 100-step Prep flow coming from 20 datasources.
  • Filter your Distribution Table so it returns only one row: the desired groups for distribution.
  • Join your Flow Result to your Distribution Table. There’s no matching columns here, so you’ll need to join on 1=1. This will perform a cross join, adding the Group Names to every row of your Prep Flow.
  • Add a Script step (more details below).
  • Add an output, publish your Flow, and schedule it to refresh on the schedule of your choosing!

Once you’ve followed the above steps, Tableau will, at the appropriate interval that you’ve chosen, run your entire ETL flow, send a CSV to all of the appropriate users, and publish the .hyper file to Tableau Server. You can even make this resuable by publishing up all of the “scheduling” steps to your Tableau Server so other people can reuse it.

Publish the entire flow except the data input step. This makes it a reusable distribution tool for other to download and plug into their own flows!
Right-click and insert the published steps into any flow you’re working on.
Drag the output of your existing flow as the input to your inserted flow. Change the filters on your Distribution Table to the desired schedule and simply publish your new flow. It’ll send to the chosen groups on the schedule of your choosing.

So what’s the magic of the Python script? It does a couple things in this case, and all of the code is available here. It does a couple of things.

  1. Logs in to Tableau Server.
  2. Gets the list of all users on the Site.
  3. Finds which users are in the specified Groups.
  4. Compiles a list of those addresses.
  5. Sends an email to all of those people!

I’ve broken it out into two functions.

  • emailer()
  • GroupMailer()

The emailer() function is pretty simple. It takes two arguments: a list of emails and a dataframe. Tableau Prep’s Python integration requires that you create a function which takes in a dataframe and returns a dataframe. In this case, we’re just taking in the data that you’d like to distribute. We do no modifications at all to it, just send it via email and return it to Tableau Prep.

The GroupMailer function is the more complex one. It leverages a couple calls from Tableau’s REST API to find all of the necessary email addresses and compile them into a list, which is then used in the emailer() function. You could, of course, create your own list of email addresses and pass that in instead.

To facilitate that, I built a separate function called PersonMailer(). It functions almost exactly like the GroupMailer() function, but allows you to pass in comma-separated email addresses instead of relying on Tableau to generate them. The downside of this is that it’s harder to scale (reports often go to thousands of users), but the upside is that these users don’t need to be licensed on Tableau Server! We’re simply using Python to send the emails out, so if you need to send it to unlicensed users, distribution lists, or dummy email addresses, this function should work perfectly for you.

Web Data…Conductors?

Tableau 19.3 released this week, and with it came a whole host of features, including Server Management, Explain Data, and Data Catalog. Data Catalog (a part of the Data Management Add-on) allows you to see what data is being used on your Tableau instance, how people are using it, what tables they’re using in conjunction with what, and all of the associated lineage. On top of that, it allows you to write alerts, notify data users of outages/delays, and predict the impact of deprecating individual data assets. All of these features have created a renewed interest in the Data Management add-on, which also includes Prep Conductor.

One of the new features released within Prep in 2019.3 is the ability to use Python/R within your Prep flows. Now my experience with Python is effectively 0, but there is a really easy and cool use case worth documenting. Tableau has long had the ability to connect to API-based data through Web Data Connectors or the Extract/Hyper API, but both of these remove you from the Tableau interface. Hosting Web Data Connectors can be a hassle and require extra admin work, and the Hyper API exists entirely outside of Tableau, giving you little visibility to when (or if) tasks finish. The Python Prep node requires only that you create a function which take a dataframe as an argument and returns a dataframe, and this means you can now create entirely (or partly) web-based data connections entirely in-flow. The steps are below.

  1. Create a function which takes a dataframe as an argument.
  2. In that function, ping the necessary API.
  3. Convert the return from that API into a dataframe.
  4. Define the schema of that new dataframe.
  5. Save your Python work as a .py file.
  6. Create a Prep flow with an input, a Script node, and an output.
  7. Publish it!
  1. Create a Python function. In a text editor of your choice, you’ll simply define a function. It must take a dataframe as an argument, as this will be the data passed from your Prep flow into the function.
def APIcall(df):

2. Ping the necessary API. In this case, I’m using a stock-ticker API from alphavantage. You should get your own API key, but mine is published here. This API call returns a dictionary of CRM (our new overlord) stock data history. For this, I’m using the requests library.

def APIcall(df):
    r = requests.get("https://www.alphavantage.co/query?function=TIME_SERIES_DAILY&symbol=CRM&apikey=UT5SGBK00NBXYLK1&outputsize=full")

3. Convert the return from that API call into a dataframe. To do this, I’m using a couple of pieces. I use the json library to convert the string response from the API into a dict, then use pandas to convert the dict to a dataframe.

def APIcall(df):
    r = requests.get("https://www.alphavantage.co/query?function=TIME_SERIES_DAILY&symbol=CRM&apikey=UT5SGBK00NBXYLK1&outputsize=full")
   dfWorking = pd.DataFrame();
    data = json.loads(r.text)
    data = data["Time Series (Daily)"]
    dfWorking = pd.DataFrame.from_dict(data, orient='index')
    return dfWorking

This returns all of my data, but my dates are being used as an index, not a column.

def APIcall(df):
    r = requests.get("https://www.alphavantage.co/query?function=TIME_SERIES_DAILY&symbol=CRM&apikey=UT5SGBK00NBXYLK1&outputsize=full")
    dfWorking = pd.DataFrame();
    data = json.loads(r.text)
    data = data["Time Series (Daily)"]
    dfWorking = pd.DataFrame.from_dict(data, orient='index')
    dfWorking['date'] = dfWorking.index
    return dfWorking

4. Define (and match) the schemas. The Tableau help article here shows how to define the schema that we’re returning. On top of that, though, we need to make sure that our dataframe has the appropriate types. Even though the stock prices look like decimals, the API returned them as strings. First, I recast those values as floats, then I define the schema of the dataframe I’ll send back to Tableau. Make sure you also import all of the necessary libraries.

import requests;
import pandas as pd;
import json;
def APIcall(df):
    r = requests.get("https://www.alphavantage.co/query?function=TIME_SERIES_DAILY&symbol=CRM&apikey=UT5SGBK00NBXYLK1&outputsize=full")
    dfWorking = pd.DataFrame();
    data = json.loads(r.text)
    data = data["Time Series (Daily)"]
    dfWorking = pd.DataFrame.from_dict(data, orient='index')
    dfWorking['date'] = dfWorking.index
    dfWorking = dfWorking.astype({'5. volume': 'int32'})
    recast = ['1. open', '2. high', '3. low', '4. close'];
    for f in recast:
        dfWorking = dfWorking.astype({f: 'double'})
    return dfWorking
def get_output_schema():
    return pd.DataFrame({
        'date' : prep_date(),
        '1. open' : prep_decimal(),
        '2. high' : prep_decimal(),
        '3. low' : prep_decimal(),
        '4. close' : prep_decimal(),
        '5. volume' : prep_decimal(),
    });

5. Creating a Prep flow. This part is easy. Simply open Prep and connect to data. Even though the data we return will be entirely API-based, Tableau requires that you connect to a set of data (and it has to have at least one row). In my case, I used Superstore. Turns out you really can demo anything using only Superstore. You’ll need a TabPy server set up, but the rest is easy. Simply connect to any dataset, run your newly-created Python script, and create an output on Server. Now schedule that to refresh and you’ll get API-based data with all of the monitoring Tableau has to offer!

So how does this really work? Tableau takes in a dataframe from your datasource, throws out that data, and replaces it with your new dataframe. What else can we do with this? All sorts of things. Now you’ve got your API-based data in a Prep flow. Want to union it to something? Run cross-db joins? Pivot it? Join it to a published datasource so you can correlate stock prices with the times your customers purchase? The world is your oyster. Of course, you can also make more complex scripts. For example, you could simply incorporate a for-loop into this script an return the data for any number of tickers that you want. To find the history of Tableau, for example, I need both the CRM and DATA tickers. I’ve created an array below which allows for an input of tickers and an output of a hyper file with all of the stock data for both companies.

import requests;
import pandas as pd;
import json;
def APIcall(df):
	tickers = ["NKE", "CRM"];
	dfWorking = pd.DataFrame();
	recast = ['1. open', '2. high', '3. low', '4. close'];
	for i in tickers:
		r = requests.get("https://www.alphavantage.co/query?function=TIME_SERIES_DAILY&symbol=" + i + "&apikey=UT5SGBK00NBXYLK1&outputsize=full")
		data = r.text
		data = json.loads(data)
		data = data["Time Series (Daily)"]
		newFrame = pd.DataFrame.from_dict(data,orient='index')
		newFrame['date'] = newFrame.index
		newFrame['ticker'] = i
		dfWorking = dfWorking.append(newFrame)
	for f in recast:
		dfWorking = dfWorking.astype({f: 'double'})
	dfWorking = dfWorking.astype({'5. volume': 'int32'})
	return dfWorking


def get_output_schema():
    return pd.DataFrame({
        'date' : prep_date(),
        '1. open' : prep_decimal(),
        '2. high' : prep_decimal(),
        '3. low' : prep_decimal(),
        '4. close' : prep_decimal(),
        '5. volume' : prep_decimal(),
        'ticker' : prep_string()
    });

Make a viz out of that dataset and see exactly how valuable Tableau was to Salesforce! Or set up your own script and automate other cool workflows. Want to send out your dataset as a CSV? Simply incorporate that into the Python script. Even though it has to take in and return a dataframe, that doesn’t mean all it can do is ETL. Have fun with it!

Publishing TDS Datasources Using Tableau Prep

NOTE: Tableau went and fixed this in 19.3.1, so if you’re using that or a newer version, stop reading here and just accept that it all works!

Though Tableau originated as a visualization tool, it has added significant ETL processes over the last couple versions. With version 18.1 it added Tableau Prep and the ability to build ETL flows, and 19.1 added Prep Conductor, which comes with the ability to automate workflows to run on a schedule. One current limitation, however, is that Tableau Prep outputs a .hyper file, not a .tdsx file. What’s the difference here?

In Tableau, a .hyper file is a raw data file. It contains the results of the data from the datasources as well as any calculations which can be materialized at the individual row level (calculations like string manipulations, differences between two columns, etc.). Calculations which can’t be materialized on individual rows, however, aren’t stored in a .hyper file, but instead are saved in a .tds file (Tableau Datasource). This file contains the logic for level of detail calculations, aggregate calculations (such as ratios), and the username-based calculations often used for row level security. A .tdsx file is the combination of the raw data (.hyper file) and the associated logic (.tds file). Tableau Prep, however, doesn’t allow for the customization of .tds files. If you want to add aggregate calculations, you can do so in Desktop, but when Conductor runs your flow, it will overwrite your entire Datasource, replacing your .tds file with a generic one and losing all of your calculations in the process. Below is a walk-through of how to avoid that behavior.

Before we go any further, it’s worth noting that this workflow will probably be streamlined at some point, but that for now, this is the easiest way of allowing creating a Datasource with data from Prep and .tds-based logic.

  1. Create a Prep flow which outputs a .hyper file to a network-mapped location.
    1. In the Output step of your Prep flow, do not select “Publish as a data source”, but instead choose “Save to File”. You need to ensure that your Prep inputs and outputs are using UNC file paths, so it will continue to work when published to Server.
  2. Publish and schedule the flow.
    1. Simply publish your flow to Tableau Server. You’ll need to ensure that your Run As User has access to the file input/output locations as well as safelisting those file locations for Prep Conductor.
    2. Though we’ll tie this flow to a schedule, we won’t actually be relying on the schedule’s timing to run the flow. Therefore, you’ll want to make it a schedule that you don’t use for anything else and only runs very infrequently. I set mine to run monthly on a schedule named “PrepScriptSchedule”. The reason we need to tie it to a schedule (even though we aren’t relying on timing) is that tabcmd allows us to run a scheduled task.
  3. Open the output of the flow in Tableau Desktop.
  4. Create your Datasource modifications in Desktop (create calculations, Datasource filters, hierarchies)
  5. Publish the Datasource.
  6. Using tabcmd, refresh the .hyper file and publish it without overwriting the Datasource.
    1. If you’re not already using tabcmd, you’ll need to install it.
    2. Log in to the Server using tabcmd login.
    3. Run the Prep flow using tabcmd runschedule.
      1. Because we’re running a schedule (not executing a task on Tableau Server), we’ll need to build in a wait time for our script. This step has started the Prep Flow, but we’ll need to pause until it finishes creating the file.
    4. Pause the script until the flow is complete using SLEEP. This command takes an argument which is the number of seconds to pause your script. You should make sure that the number you input here is higher than the time your Prep Flow takes to run.
    5. Using the tabcmd publish command, point to the .hyper file output from the Prep flow and overwrite the Datasource in question. Use the –replace option to avoid overwriting the .tds, instead just overwriting the source data contained in the .hyper file.
tabcmd login -s https://<server-name> -u <username> -p <password> -t <siteName>
tabcmd runschedule "PrepScriptSchedule"
sleep 1000
tabcmd publish "\\network\filepath\prepoutput.hyper" -n <targetDatasource> --replace

It’s an easy script to run, and can be run on the schedule of your choice using any task scheduler (most likely Windows Task Scheduler or as a cron job). Using the above script we can create Tableau Datasources with Prep ETL, Desktop metadata, and Server security, and refresh it all on a schedule. Go forth and enjoy your complex data structures with complex governance tied in!

Filter Yourself: Using Reflexive Sheet Actions for Drilldowns or Disappearing Acts

Tableau’s dashboard actions allow easy interactivity between sheets. New users to Tableau are familiar with clicking the “Use as Filter” icon and seeing that everything they click just magically…works. More experienced users have likely gone into the Dashboard Actions menu and created their own Filter actions. Dashboard actions can easily filter across different fields, reference different datasources, or even take the user to a different dashboard. With Set Actions, Tableau has even enabled interactivity that didn’t previously exist. Set Actions make it easy for a sheet to even filter itself, adding and removing members to a set which is used as a filter.

The one thing that IS difficult in Tableau, however, is having sheets target themselves as filters. When creating a new dashboard action, you can set a sheet to target itself by setting it as both the Source and Target sheet, but it won’t change the behavior.

Even though the Map is both Source and Target, clicking a State doesn’t filter itself.

For the most part, we don’t want actions to target the source sheet. If the above action did select a single State, the top sheet would become useless (and create a confusing UI).

There are times, however, when this type of filtering makes sense. I’ve got an org chart dashboard which shows a selected employee, their manager, and everyone who works for them.

A reasonable follow-up question to this is “Who else works for Josh?”. I’d like to click on Josh McDaniels and filter the entire dashboard to show his manager, his employees, and his information. This requires having my Manager sheet filter itself when Josh is clicked on.

We’ve already shown, however, that selecting a sheet as Source and Target does nothing. Instead, the correct setup requires setting it as the source sheet, but changing the way we target it. Rather than selecting the Target as a sheet which is part of the dashboard, we target it as an individual sheet. We also need to target a different field…we’re clicking on a manager, but we want to treat him as an employee once the dashboard updates.

The target isn’t the “sheet as part of the dashboard”. Instead, choose the sheet as a standalone piece.

It’s important to set “Clearing the selection will:” to “Leave the Filter”. When a sheet filters itself, it first filters everything out. Because the sheet now returns an empty set on which nothing can be selected, Tableau (frustratingly) treats this as clearing the selection. We need the filter to persist through this phase of filtering.

So the combination of targeting a specific sheet and leaving the filter allows us to self-target with a dashboard action. This is immensely useful in any hierarchy, where we can easily click up or down through the hierarchy without ever having to reset the dashboard. Where else are self-actions useful? Hiding and showing a menu is another great use case.

Using the same org-chart dashboard example, we have to start by selecting an employee. Our end-user can log in, select a employee, and have the dashboard populate for that employee. From there, they can navigate to any point in the hierarchy by simply drilling up and down…but if they want to navigate to an employee in a totally different part of the company, they may have to go all the way to the top and then guess their way through upper management. Instead, we could provide them an interface to select an employee. Once they make a selection, the menu disappears. Again, we can accomplish this with a self-targeted action.

First, though, we’ll need two calculations. I call them [Dummy Dimension] and [Dummy Dimension 2]. [Dummy Dimension] is simply the integer 0, and [Dummy Dimension 2] is simply the integer 1. Now I set up a self-filter using the above methodology. To make the sheet hide itself, though, we have to set up a filter condition which returns an empty set.

Clicking on this sheet will now create an action which finds rows where [Dummy Dimension] = [Dummy Dimension 2]. As far as I’ve ever found, 1<>0, so the whole sheet is hidden.

Pairing this with other actions allows this click to hide the “menu” sheet as well as driving interactivity on the rest of the dashboard. Of course, you may need to get your menu back at some point. When you click on this action, it grabs the value 0 from [Dummy Dimension], but it only sets the filter on the field [Dummy Dimension 2]. The resulting filter is the equivalent of filtering [Dummy Dimension 2] for the value 1. Any filter which filters on [Dummy Dimension 2] by filtering for 1 instead will therefore replace this filter…re-showing the sheet.

Overall, you can use dashboard actions to create all kinds of magic filtering on a single dashboard. Whether it’s a sheet hiding itself, bringing that sheet back, or using actions to create in-place drill-up and drill-down through hierarchies, Dashboard Actions are far more flexible than the one-click option of “Use As Filter”. The dashboard I linked at the beginning of this post uses 12 different dashboard actions…across only 5 sheets. Can you do it in fewer?